

e‑shop
rezervace
Události
vyskakovat

- 10%
Area Chart
od
Area Chart and Graph for Data Visualization
Zatím žádné hodnocení
14denní zkušební verze zdarma




Přehled – Area Chart
- Show trends at a glance: turn rows of numbers into an area chart your visitors read easily
- Keep your data current: type values in the settings panel, or feed the chart from a JSON link or Velo code
- Compare series: add several lines to one chart and give each a solid or dashed stroke
- Match your design: adjust the chart style so the graph fits the look of your brand
Hodnocení & Recenze
Tato aplikace zatím nemá žádná hodnocení, buďte první, kdo ji ohodnotí.Ceny a plány
Tato aplikace nabízí 14denní zkušební verzi zdarma.Plán Premium
- 10%
$
1
34
/měsíc
$149
Showcase Your Line Charts With Ease
Various Types of Area Charts
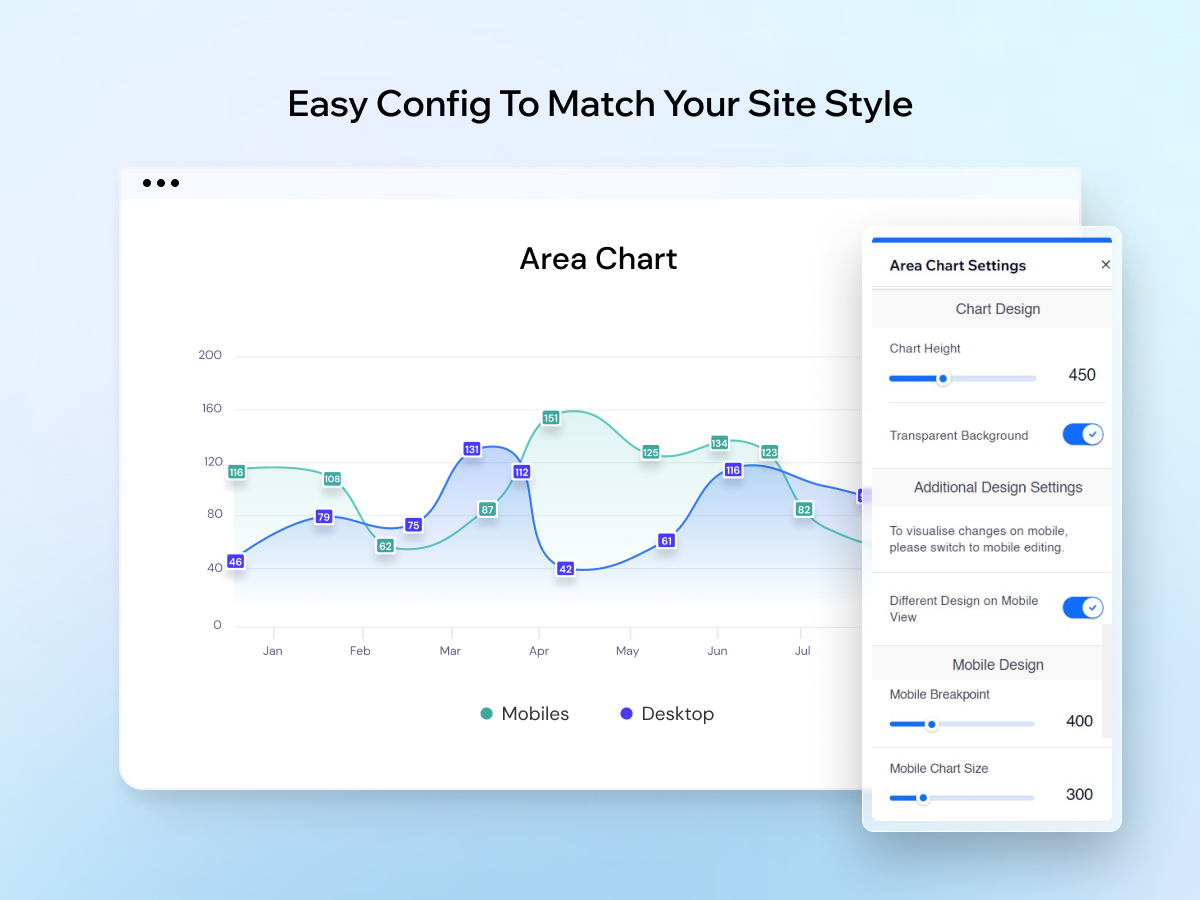
Easy Config To Match Your Site Style
* Cena je v USD.
* Tato sleva platí do 13. listopadu 2026 23:59 UTC. Vývojář aplikace si vyhrazuje právo kdykoli prodej ukončit a prodejní podmínky mohou podléhat změnám.